The Job Openings and Labor Turnover (JOLT) report for March from the Bureau of Labor Statistics (BLS) indicates continued strength in the number of construction job openings, which is near the high reached at the peak of the housing boom. However, the number of people employed in residential construction has still not returned to the levels reached before the last recession.
Construction is different
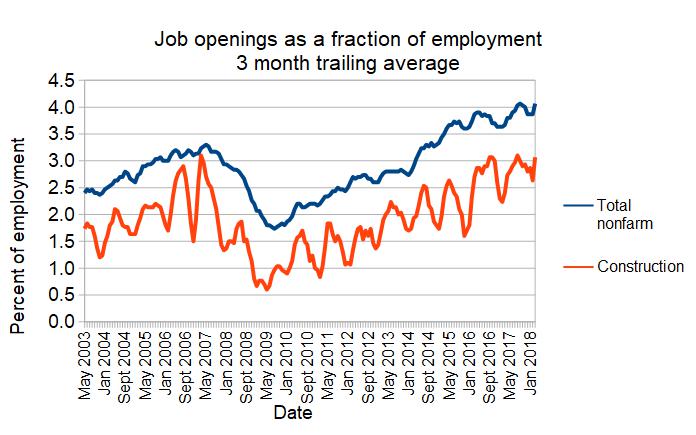
The first chart below shows the number of construction job openings as a fraction of the total number of workers in the construction industry and also the percentage of job openings for the economy as a whole. The relative number of construction job openings at any give time is lower than for the economy as a whole. This is in spite of the fact that there are reports that the scarcity of construction workers is hampering building projects.
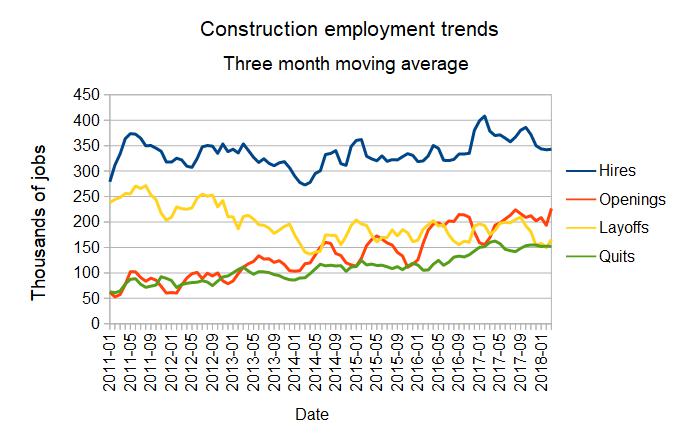
The chart above shows other employment measures for the construction industry as given by the JOLT report. Note that the number of job openings is a snapshot taken at the end of the month while the numbers of hires and separations are the cumulative values for the entire month. If the number of hires in a month is much greater than the number of job openings, then, on average, it takes much less than a month to fill a job opening. If the number of hires is much less than the number of job openings, then, on average, it takes much more than a month to fill a job opening.
The chart shows that hiring has increased in the last few years, but not dramatically. This is in spite of the fact that the number of construction job openings has gone up significantly. This indicates that, while the construction industry is not employing many more people, it does seem to be taking longer than in the past to fill its available openings.
Still, it should be noted that the unemployment rate reported for construction workers is currently 6.5 percent, the highest of any major industry category.
Something that has changed in recent years is that the number of layoffs has fallen and the number of voluntary quits has risen. In other words, construction companies are holding on to the workers that they have rather than cutting them loose. At the same time, workers are feeling more confident in their employment prospects so they are not just keeping whatever job they can get.
Taking the long view
Data from the Current Employment Statistics survey, also issued by the BLS, provide another view of the construction labor market.
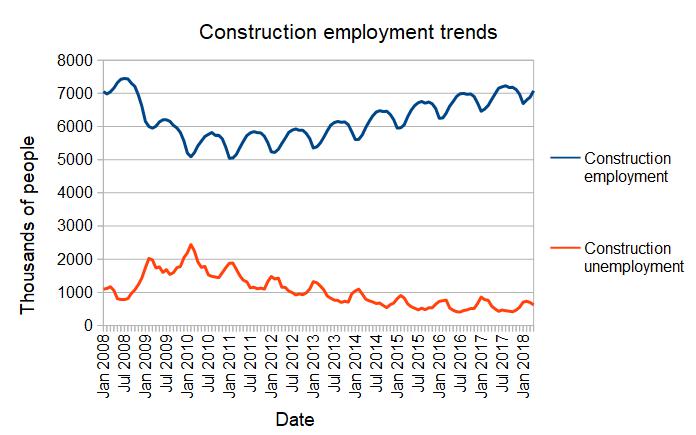
The chart below shows the number of construction workers who were employed or unemployed over time. In the worst months of the recent downturn, 30 percent of construction workers were unemployed. While things have gotten better for job seekers, the total number of those participating in the construction industry, employed and unemployed, in April, 2018 is still 6 percent lower than it was in April, 2008.
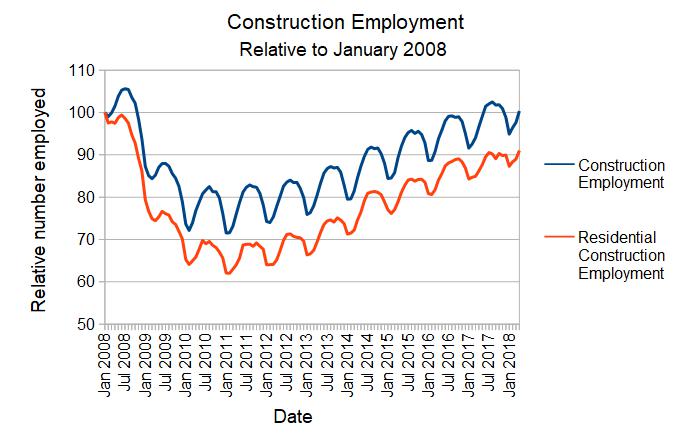
The final chart shows the number of people employed in the construction industry and in the residential construction sub-group relative to the numbers employed in January, 2008. The employment level in January, 2008 is shown as 100 and every point on the scale represents a one percent increase or decrease in employment from that level. The chart shows that residential construction employment was particularly hard hit in the recent downturn and is still about 10 percent below the levels of 10 years ago.