The Bureau of Labor Statistics (BLS) released its producer price index report for June. It showed that overall prices for processed goods for intermediate demand were up 0.7 percent in June and they increased 6.8 percent from a year earlier. This compares with a 2.9 percent rise in the all-items consumer price index (CPI) in the 12 months to June.
The BLS index of materials and components for construction advanced 0.6 percent from May, 2018 and was 6.0 percent higher than a year earlier.
Multihousing Pro (MHP) compiled the BLS reported price changes for our standard list of construction commodities. These are commodities whose prices directly impact the cost of constructing an apartment building. The two right hand columns of the table provide the percent change in the price of the commodity from a year earlier (12 Mo PC Change) and the percent change in price from May, 2018 (1 Mo PC Change).
Lumber prices set the pace
Lumber prices of lumber continued to show major gains in June from their levels of a year before, advancing up to 30 percent. Prices of copper and steel items also advanced strongly. On the other hand, several commodity classes saw annualized price increases of less than the overall rate of inflation as measured by the CPI, including sheet metal AC ducts and stove pipe, builder’s hardware, enameled iron and metal sanitary ware, and mineral wool insulation.
The table shows the price changes for our collection of construction materials. While the BLS reported rise in construction material prices is less than that for processes goods for intermediate demand overall, many of the items in our collection have experienced significant price increases over the last 12 months.
| Commodity | 12 Mo PC Change | 1 Mo PC Change |
| Softwood lumber | 23.2 | 4.0 |
| Hardwood lumber | 8.2 | 0.9 |
| General millworks | 2.1 | 0.5 |
| Soft plywood products | 30.8 | 2.0 |
| Waferboard and oriented strandboard (OSB) | 22.9 | 2.2 |
| Hot rolled steel bars, plates and structural shapes | 17.3 | 2.4 |
| Copper wire and cable | 12.1 | 3.7 |
| Power wire and cable | 19.6 | 0.8 |
| Builder’s hardware | 1.1 | -0.1 |
| Plumbing fixtures and fittings | 3.2 | 0.0 |
| Enameled iron and metal sanitary ware | 1.7 | 0.0 |
| Furnaces and heaters | 3.5 | 0.0 |
| Sheet metal AC ducts and stove pipe | -0.2 | 0.0 |
| Electrical Lighting fixtures | 2.6 | 0.0 |
| Nails | 15.5 | 6.3 |
| Major appliances | 3.1 | 0.4 |
| Flat glass | 3.2 | 0.7 |
| Ready mix concrete | 5.5 | -0.5 |
| Asphalt roofing and siding | 7.8 | -0.7 |
| Gypsum products | 2.6 | -1.2 |
| Mineral wool insulation | 2.0 | 0.0 |
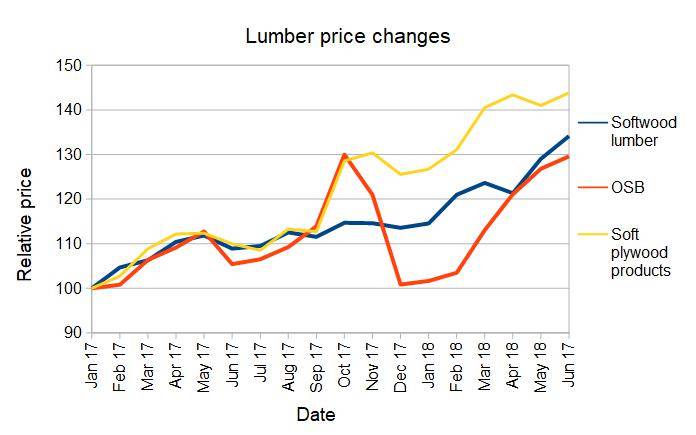
The chart below illustrates the price changes for softwood lumber, OSB and soft plywood over the past year and a half relative to their prices in January, 2017. While the price of OSB has been much more volatile than those of the other two products, the increase in lumber prices have outpaced the increase in the price of OSB over the last 18 months.