

The Census Bureau released its new monthly residential construction report for April 2019. The report shows relative strength in the three measures of multifamily housing construction activity that we track.
Permits rise
The preliminary report for April shows that permits for buildings with 5 or more units were up by 7.1 percent from March, to 467,000 units on a seasonally adjusted, annualized basis. This is the highest level since March 2018. Compared to the year-earlier level, permits for buildings with 5 or more units were up 1.5 percent.
In addition, 47,000 permits were issued in April for buildings with 2 to 4 units, also a recent high.
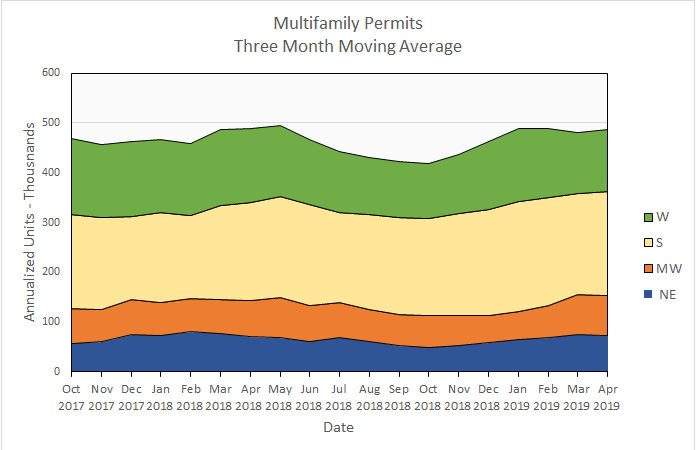
Regional data for multifamily housing is only reported for structures with two or more units. “Structures with 5 or more units” is not broken out as a separate category. Since the regional data is highly volatile and is frequently revised, it is examined here based on three month moving averages.
Nationally, the three-month moving average for permits issued for multifamily housing in April was up by 1.2 percent from the March level and was down 0.3 percent from the level of April 2018. This is shown in the first chart, below.
On a month over month basis, the Northeast showed a slight decline in permitting activity, the Midwest was essentially unchanged and the South and the West showed slight increases in permits issued.
Again this month, the West was the only region to show a decline in permits issued compared to year-earlier levels, with a decline of 16.3 percent. The Midwest had the highest rate of increase with a rise in permits issued of 9.5 percent while permits in the South were up by 6.9 percent.
Multifamily housing construction starts tick upward
The April report on construction starts for buildings with 5 or more units showed an increase of only 2.3 percent from the March level. However, the figures for March were revised upward strongly from last month’s preliminary report of 337,000 units to a revised level of 351,000 units on a seasonally adjusted, annualized basis. Without this revision, the reported rise would have been 6.5 percent.
Compared to year-earlier levels, construction starts for buildings with 5 or more units were up by 1.4 percent.
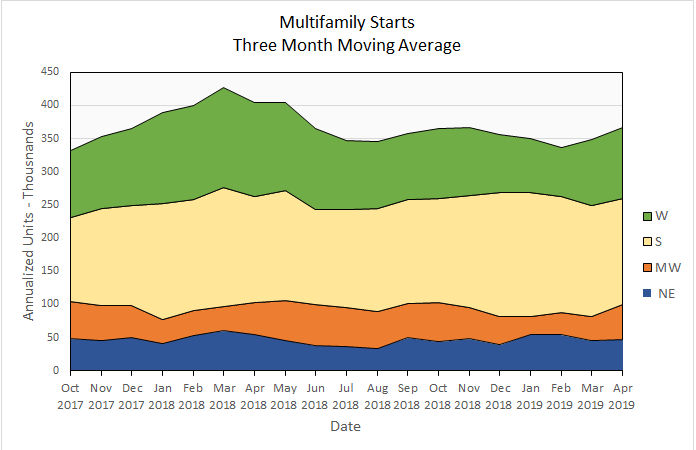
Multifamily housing construction starts (two or more units per building) were up 5.4 percent from their March levels for the country-as-a-whole, based on three-month moving averages. The Midwest region continued its rebound from recent weakness with starts rising 45 percent for the month. The Northeast and West regions saw single-digit rises in starts while the South saw a 5.4 percent decline in starts from the month-earlier level.
On a year-over-year basis, starts were down 9.2 percent for the country-as-a-whole. However, the numbers of starts in the spring of last year was exceptionally high and the annualized three-month moving average of starts seen in April, 367,000, is actually slightly above the recent average for this metric.
By region, starts were up 11 percent in the Midwest and down in other regions of the country. The West saw the largest rate of decline with starts falling 23 percent.
The following chart shows the starts by region for the last 18 months.
Completions continue strong
Nationally, completions of buildings with 5 or more units rose 5.8 percent this month from the March figure, which was itself revised down slightly. April completions were reported to be 381,000 units on an annualized basis. This figure was down 14.2 percent from April 2018, but that month had the second highest rate of completions in the last two years and was something of an anomaly.
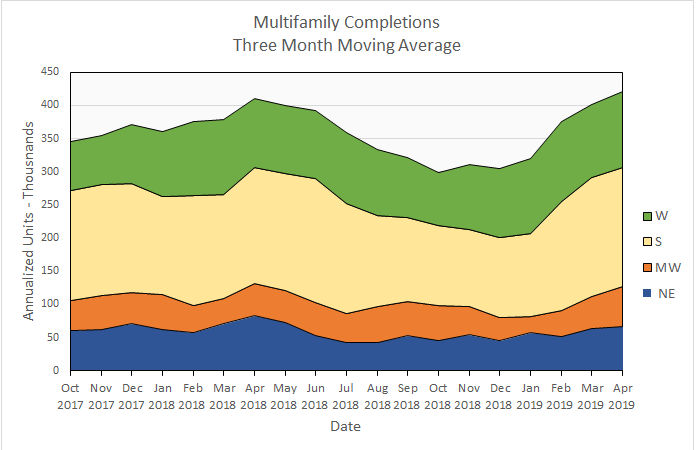
For the country-as-a-whole, completions for multifamily housing (two or more units per building) were up 4.6 percent month-over-month when comparing three-month moving averages. Completions were up by strongly in the Midwest but up only modestly in the other regions of the country.
On a year-over-year basis, the three-month moving average of completions was up by 2.3 percent despite being compared to a very strong period for completions last year. The Midwest region saw the highest rate of increase, with completions rising 23 percent. The West and South regions also saw increases, but completions fell 19 percent in the Northeast. Nationally, the three-month moving average for multifamily housing completions came in at 420,000 units on an annualized basis, a recent high.
Completions by region for the past 18 months are shown in the chart below.
All multifamily housing construction data quoted are based on seasonally adjusted results and are subject to revision.


